SEM-RAMAN ANALYSIS
of layer stack (case 18)
QUESTION:
What’s the layer thickness of an adhesive layer?
In a composite laminate foil, made of a layer stack of paper, Al and several polyethylene-based (PE) polymers, the layer thickness of the adhesive layer in between PE and Al was requested.
The adhesive layer turned out to be just another PE-based polymer. How to disentangle the adhesive layer and the PE top layer?
APPROACH:
SEM and Raman spectroscopy
A cross-section of the foil, made with a diamond knife in an ultramicrotome, was investigated by SEM. The Al and PE layers could clearly be revealed. With regard to the thin adhesive layer, however, it was uncertain whether what was seen in the cross-sectional SEM image was real or rather an artefact.
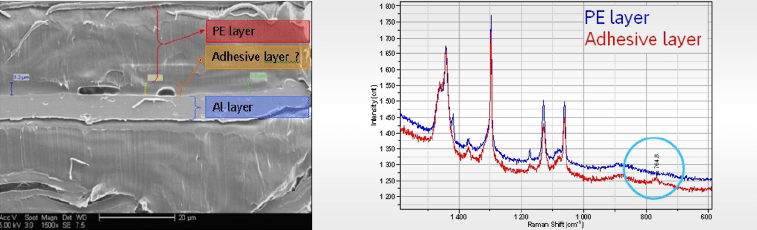
SEM image on microtomed cross-section of laminate foil – assignment of adhesive layer in the layer stack is unsure.
It was therefore decided to map the cross-section of another aliquot from that layer stack sample with a Raman microscope using a 1 µm spot size. With the Cross-Section-Polisher (a device which makes cross-sections using an Ar-ion-beam), a very flat polished cross-section was prepared for investigation in the Raman microscope.
The Raman spectrum of the adhesive layer, also being PE-based, was very similar to neighboring PE-layer, but could still be differentiated from it by the presence of a small additional band in the spectrum of the adhesive layer at 765cm-1, which stems from the co(ethylene-MAA).
Detail of the 2 Raman spectra, indicating the additional band at 765 cm-1 used as tracer to differentiate the two PE species.
This opened the possibility to determine the adhesive layer thickness by making a line scan over the cross-section, thereby monitoring the intensity variation of this small band in the spectrum.
The example shows an adhesive layer which is only about 1.7 µm thick. (Be aware that the order of the layers is reversed with respect to the SEM image above.)
Position of the Raman line scan in the cross-section and intensity map of the tracer band at 765 cm-1.
RESULT:
Fast and sure layer stack analysis
A set of composite foil samples having different adhesive layer thicknesses were measured with both Raman spectroscopy and SEM. From their comparison, it could be concluded that the layer that could faintly be observed in SEM does indeed correspond to the adhesive layer in question. New samples could therefore be analyzed with full confidence in SEM, which is faster than the Raman line scan method.
The layer stack analysis of complex foils and coatings (e.g. determination of stack architecture, layer thicknesses, chemical composition of individual layers) often requires a combination of different analytical techniques. Cross-sectional SEM and/or TEM is essential, but it often has to be complemented by other means, such as staining techniques.
Related Cases


Let's Talk
Fill out this form, and we'll revert to you as soon as possible.
Please provide a detailed description of your question or request.